Chapter 5 Covariance and Correlation
Variance is one of two major concepts in statistical modeling. The second is covariance, which arises when two variables measured on the same unit vary together. “Vary together” means that if we measured leg length and arm length on each individual in a sample of humans, we’d expect individuals with long arms to also have long legs while those with short arms to have short legs. “Measured on the same unit” means that we measure both leg length and arm length in each individual of a sample – we cannot compute a covariance if we measure legs in one sample and arms in a second. Covariance can be positive or negative. It is positive when the tendency is for both values to be large or both values to be small. It is negative when the tendency is for one value to be small when the other is large. Positive and negative covariance are easily visualized with a scatterplot 5.1.
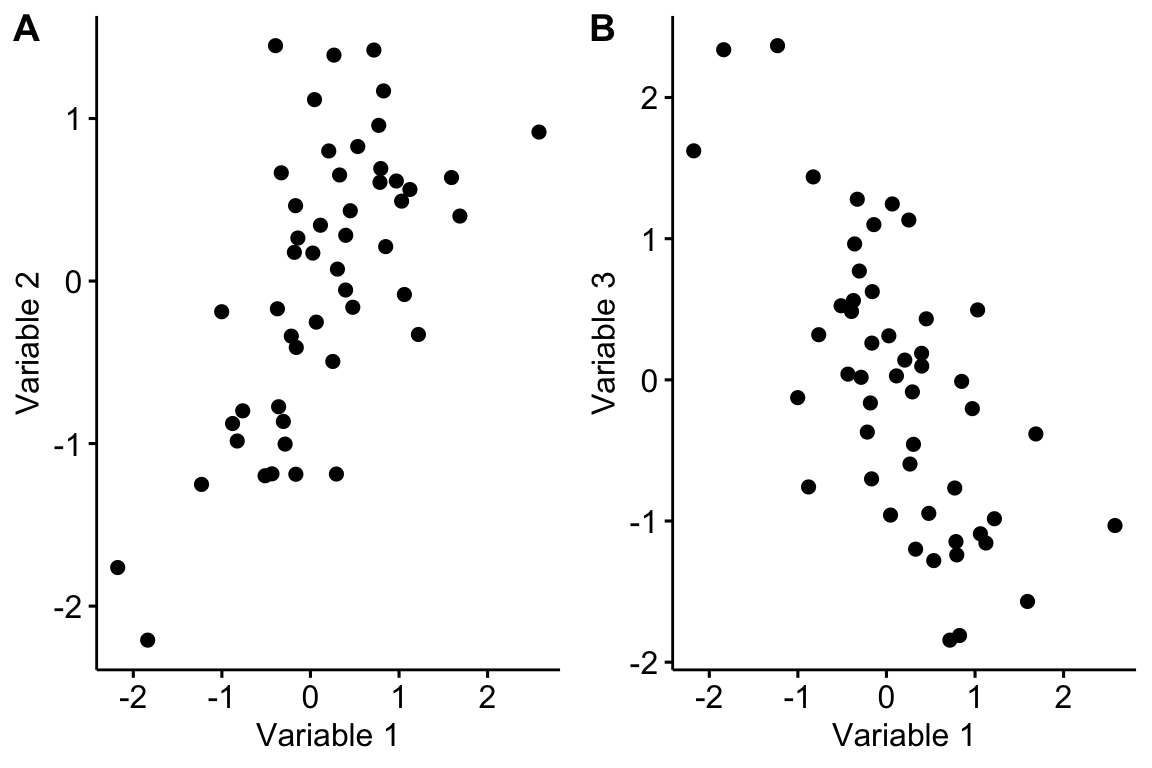
Figure 5.1: Scatterplot illustrating two variables with (A) positive covariance and (B) negative covariance
- Covariance
COV[X,Y]=n∑i=1(xi−ˉx)(yi−ˉy)n−1
Compare this to the equation for the variance. In (5.1), the numerator in the sum is the product of two different deviations (one for each variable) instead of the product of a deviation with itself.
Correlation
Regression